
Does Active Investing Outperform Index Investing
- STRS Ohio Watchdogs

- May 17
- 7 min read
Updated: May 18
By Rudy Fichtenbaum
In my previous post Why Is It So Hard to Beat an Index, I explained how an index works and why it is hard in theory to beat an index. In this post, I review the results compiled by Standard and Poor’s (SPIVA), the definitive source of information comparing index investing to active investing, to see how active management underperforms index investing.
SPIVA data corrects for survivorship bias by taking into consideration funds that are liquidated or merged. If you compare funds’ performance over 20 years and fail to consider funds that went out of business because of poor performance, then you are creating an upward bias in performance of surviving funds in comparison to an index. How important is survivorship? In Figure 1, we can see that over a 20-year period, less than 40% of funds survived except for emerging markets and small cap. International where approximately 50% survived. But for example, among U.S. domestic equity funds, only 36.4% survived.
Figure 1. Survivorship

Now to state the obvious in the case of pensions, at least in the public sector, most survive but of course they will frequently change fund managers when they underperform. However, given the statistics we have just cited, changing managers seems like rearranging the deck chairs on the Titanic since most managers do not survive 20 years. Ironically, the place where you might survive 20 years is in a pension that does its own investing where you can develop custom benchmarks to hide the reality that your pension would likely have been better of using index investing.
SPIVA also uses asset-weighted returns. So, when SPIVA looks at performance, they take the size of funds into account when calculating returns and risk. For example, if one fund has $10 billion in assets and a 10% return and another firm has $1 billion in assets and a 12% return you cannot just take the simple average, which would be 11%. You should instead take a weighted average considering that the larger fund is 10 times the size of the smaller.
SPIVA also measures style consistency over time by looking at style drift. For example, managers might tell investors that their fund is a large cap fund, but when the managers find their fund is not doing well relative to a large cap index, they add some small cap stocks to increase their returns but continue using the same large cap index as their benchmark. Figure 2 shows the percentage of equity funds maintaining a consistent style. Again, we can see that most of the time, funds do not maintain a consistent style of investing. Funds that change their style of investing should change their benchmarks accordingly, for doing otherwise misleads investors.
Figure 2. Style Consistency

In Figure 3, we can see that for all domestic equity funds over a 20-year period less than 3% beat their benchmark (an index). The best performing style was large cap value funds who only lost to their benchmark 83 % of the time followed by where real estate funds and small cap value who only lost to their benchmark 86% percent of the time over a 20-year period. In summary, the record of performance across all actively managed U.S equity funds is abysmal when it comes to outperforming an index.
Figure 3. U.S. Equity: Active Funds v. Benchmark

Figure 4 shows performance for international equity funds. The results are to the performance of U.S. funds. For international equity, again small cap funds having the best performance, with about 1/3 outperforming an index over 20 years. We often hear that there are opportunities for outperformance in emerging markets, but the data clearly belie this claim.
Figure 4. International Equity: Active Funds v. Benchmark

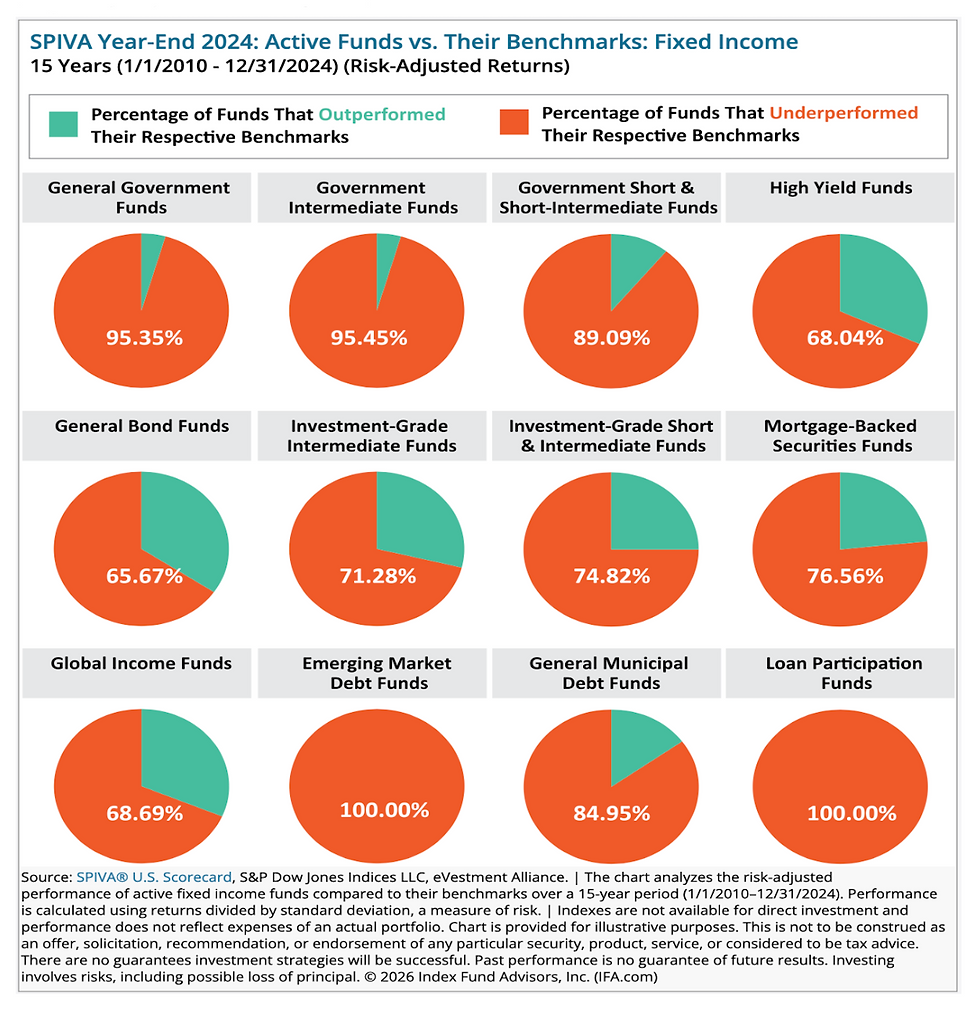
What about fixed income? Figure 5 shows performance for fixed income investments. Again, we often hear that there are opportunities exploiting inefficiencies in fixed income. Here we can see that there is virtually no chance of outperforming an index in intermediate government funds. The three best areas are in global income funds, mortgage-backed funds, and high yield funds. But again, in no category do anywhere close to 50% of the actively managed funds outperform their benchmarks, and generally these are the riskiest areas, although I should point out that the results in all the SPIVA charts are risk-adjusted. Nevertheless, it is clear that the odds of outperforming an index in these areas are considerably less than the odds of winning at blackjack in a casino, which are about 42.2%. And I am sure that none of us would want to depend on casino gambling as an investment strategy for our pension.
Figure 5. Fixed Income
Finally, SPIVA also presents evidence on persistence. One of the things they look at is for firms in the first quartile in a given year, what percentage remain in the first quartile in year two and year 3. Remember if performance is random, in any given year there is a 25% probability of being in the top quartile. So, with random performance, the probability of being in the top quartile for 5 consecutive years is 0.1%. SPIVA’s report shows for all domestic equity funds who were in the top quartile in 2021, none remained in the top quartile in 2025. For small cap stocks 2.42 % remained in the top quartile in 2025 after being in the top quartile in 2021.These results are worse than those we would expect if performance were just random.
It is often argued that generating alpha (return above the benchmark) is easier in small cap stocks where the market is less efficient. In 2022 44.35% of small cap active managers beat their benchmark. A year later only 9.68% those same funds generated alpha and in 2025 less than 2.42% continued generating alpha. The findings for fixed income were similar. So, what the report is shows is that when alpha appears, it is largely due to luck, which is why is does not persist. Base on the findings in the SPIVA report we see the reason for the ever-present disclosure statement that “past performance is no guarantee of future results.”
Given all these SPIVA results one must be truly skeptical that STRS could consistently generate alpha, that is, beat index returns year after year. You have to ask yourself what are the chances that a relatively small group of investment staff that could beat benchmarks year after year would go unnoticed by Wall Street? – where mutual funds are losing to benchmarks over a 20-year period by a lot according to the SPIVA data we just examined. If you can do what almost no one else (save a few) can, you would be in such high demand that even a large pension in Ohio would find it hard to keep such incredibly rare talent, even with the bonuses we pay.
How is it possible that STRS touts itself as one of the best performing pensions in the U.S. regularly beating benchmarks because of its use of a relatively large internal investment staff as well as being a top performance when compared to its peers? I believe Richard Ennis has given us the answer in his paper “Cost, Performance, and Benchmark Bias of Public Pension Funds in the United States: An Unflattering Portrait” where he wrote:
Public pension funds use benchmarks of their own devising, describing them variously as “policy,” “custom,” “strategic,” or “composite” benchmarks. I refer to them as reporting benchmarks (RBs). In addition to incorporating stock and bond components, RBs may include components related to private equity, hedge funds, real estate, commodities, and other alternative assets. Both the traditional and alternative components often have multiple subcomponents, which can make the RB complex. RBs are often opaque and difficult to replicate independently. RBs invariably include one or more active investment return series and thus are not passively investable. They are subjective in several respects, rendering their fashioning something of a black art. Moreover, they are devised by the funds’ staff and consultants, the same parties that are responsible for recommending investment strategy, selecting managers, and implementing the investment program. In other words, the benchmarkers have conflicting interests, acting as player as well as scorekeeper. To state the obvious, perhaps, RBs generally do not measure up to the standards of objectively determined, passively investable benchmarks used by scholars and serious practitioner-researchers.
In his paper “Lies, Damn Lies and Benchmarks: An Injunction for Trustees” Ennis writes:
As practice evolved, [Proper Benchmarks] PBs have largely gone by the wayside in public reporting. They have given way to a new breed of [Strategic Benchmarks] SBs, which are often highly customized to fit portfolio circumstances. Such benchmarks may incorporate numerous asset classes, including for private market investments and other active strategies (which immediately defeats the benchmark purpose of evaluating the contribution of active management). Asset classes themselves may have several sub-components, making SBs complex. There are no standards or guidelines for the selection of market indexes. Index returns for alternative investments are typically nebulous, merely representing the past outcomes of a select group of investors reporting in databases like those of Cambridge Associates, Preqin or NCREIF. Reported private equity returns may be internal rates of return (IRRs), which don’t blend easily with time-weighted returns and are subject to manipulation.
In my next post I will look at how STRS performed compared to a diversified portfolio of index funds using domestic equities, international equities and fixed income from 1989 to 2025.
Stand Up for Rudy and His $100,000 Commitment to You
Throughout his career, and as an elected member of the STRS Ohio Retirement Board, Rudy Fichtenbaum fought for the rights of Ohio's educators. As an STRS board member and Chair, he stood on the front lines to protect and restore the retirement benefits teachers have earned through decades of hard work.
Now, Rudy faces a massive personal challenge. Because of his commitment to teachers, he was targeted by a lawsuit from the Ohio attorney general, incurring over $100,000 in legal fees defending his actions as a board member. While ORTA previously provided assistance, they were forced to cease due to an investigation by the Ohio Ethics Commission. Rudy must now finance this battle on his own. We cannot let an educator stand alone after he stood up for us.
Your contribution, no matter the size, makes a difference. If you are unable to donate, please consider sharing Rudy's story and his GoFundMe campaign with your network of colleagues and friends.


